How the World Eats / Chapter 2 of 8
Key categoriesWhy wheat, beef, milk and salmon behave so differently
Every food category moves through the same chain, but no two behave the same way. Some can be stored for years. Some spoil in days. Some are traded across the world. Some barely cross a border. These differences decide how each market is priced, how quickly it reacts to shocks, and where the risks sit.
Five traits that explain most of the differences
Before looking at individual categories, it helps to know what to look for. Five traits explain most of how a food market behaves. They are standard lenses in commodity analysis, not a GFO invention.
- How long it keepsGrain in a silo can last years. Fresh milk lasts days. Storable products can be held back when prices are low and released when they are high. Perishable ones must be sold, whatever the price.
- How much of it is tradedFor some products a large share of world output crosses a border. For others, almost all of it is eaten in the country that produced it. When only a small share is traded, the world market is "thin", and small changes in supply or demand move prices a long way.
- How it movesBulk commodities travel loose in the holds of large ships. Meat, dairy and seafood mostly travel frozen or chilled in containers. Fresh produce needs an unbroken cold chain. Each has different costs and different weak points.
- How the price is setSome products have public benchmark prices, set on futures exchanges or at open auctions. Others are priced through private negotiation between buyer and seller. Benchmarks make a market easier to follow. Without them, prices are harder to see.
- How fast production can respondA grain farmer can change what they plant next season. A beef producer needs years to expand a herd. An orchard takes years to come into production. The slower the response, the longer high or low prices tend to last.
Keep these five in mind. Each category below is, in effect, a different combination of them.
Grainswheat, corn and rice
- Keeps
- Years
- Share traded
- Medium for wheat and corn, low for rice
- Moves by
- Bulk ship
- Price set by
- Futures (wheat, corn); negotiated (rice)
- Supply responds in
- One season
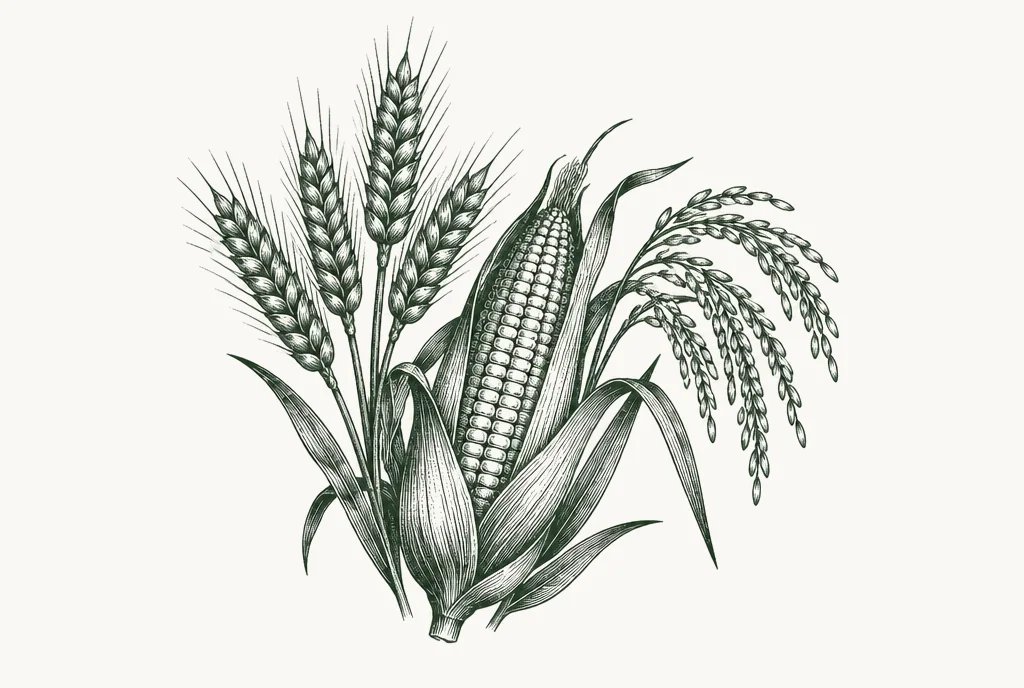
Grains are the foundation of the system. They are eaten directly as bread, noodles and rice, and they are fed to animals, which turns them into meat, milk and eggs.
Wheat is the most internationally traded of the three. Around 25% of the world's wheat supply was traded internationally in 2018–2020, compared with 16% for corn 5. The big exporters include Russia, the European Union, Canada, Australia, the United States, Argentina and Ukraine. The big importers include Egypt, other North African and Middle Eastern countries, Indonesia and China.
Corn (maize) is mostly an animal feed, and in some countries, especially the United States, a large share goes into ethanol for fuel. That link to energy markets matters. When oil prices rise, ethanol becomes more valuable, and so does the corn used to make it.
Rice is different. It is the staple food for billions of people, but very little of it is traded. Only 9.2% of the world's rice supply was traded internationally in 2018–2020 5.
That makes the world rice market thin. Global rice production for 2025/26 was projected at a record 538.7 million tonnes, while world trade for calendar 2026 was projected at 61.3 million tonnes 6.
Trade is also concentrated. India was projected to account for about 40% of world rice trade in 2026 6.
When a thin market depends heavily on one exporter, that exporter's policy decisions carry a lot of weight. India restricted rice exports in 2023, and its exports fell as a result 7. For importing countries that rely on the world market for rice, a decision in New Delhi can matter more than the weather in their own fields.

Oilseedsand vegetable oils
- Keeps
- Months to years
- Share traded
- High
- Moves by
- Bulk ship, tanker
- Price set by
- Futures
- Supply responds in
- One season (palm: years)
Oilseeds are crops grown mainly for their oil and protein: soybeans, rapeseed (canola), sunflower seed, and the fruit of the oil palm.
The key idea here is the crush. When a soybean is crushed, it becomes two products. Soybean meal is a high-protein animal feed. Soybean oil goes into cooking, food manufacturing and, increasingly, biofuels. The two products are sold into completely different markets, and the crusher's margin depends on the combined value of both.
This makes oilseeds a bridge between three other parts of the system: livestock (through meal), food manufacturing (through oil) and energy (through biodiesel and renewable diesel).
Soybean trade is dominated by one supply route. Brazil was projected to supply around 59% of world soybean trade in 2025/26 4. China is by far the largest buyer. It imported a record 111.82 million tonnes of soybeans in 2025, of which Brazil supplied 73.6% 1.
Most of those soybeans are crushed in China to feed pigs and poultry. So the soybean trade is, in effect, a trade in animal feed, and Chinese demand for meat is one of the biggest forces in the world oilseed market.
Palm oil, produced mainly in Indonesia and Malaysia, is the most widely used vegetable oil in the world. It competes directly with soybean, sunflower and rapeseed oil, so a change in one oil's supply affects the prices of all of them.
Meatbeef, pork and poultry
- Keeps
- Months frozen, days chilled
- Share traded
- Low to medium
- Moves by
- Refrigerated container
- Price set by
- Mostly negotiated
- Supply responds in
- Weeks (poultry) to years (beef)
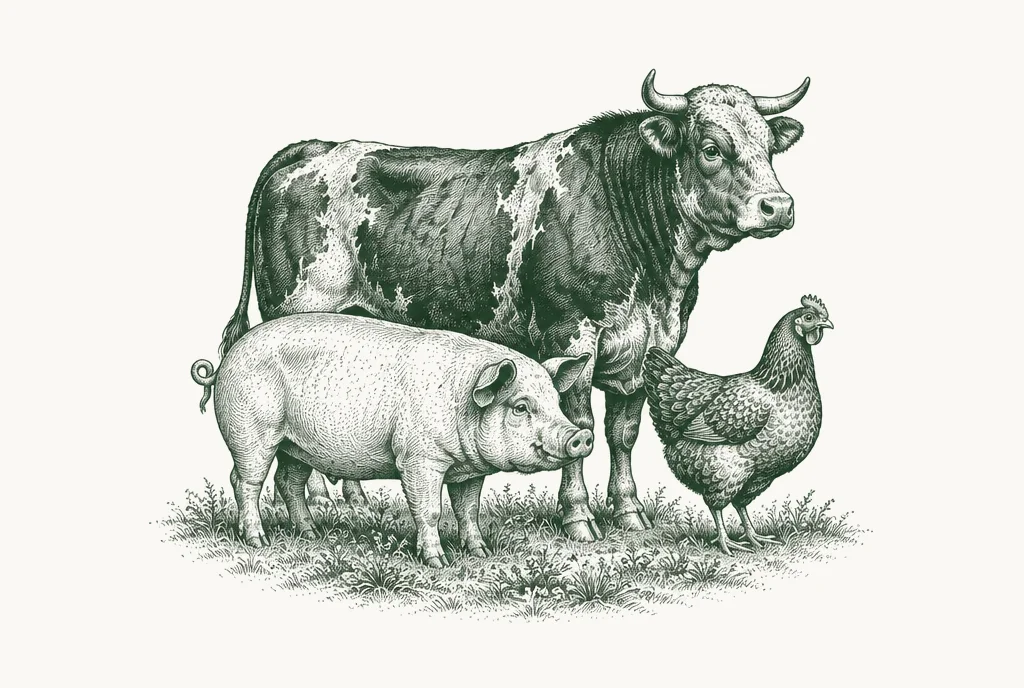
Meat turns feed into protein, and each species does it on a different timescale.
The cycle matters most. A broiler chicken reaches slaughter weight in weeks. A pig takes around six months. Beef takes years, because a heifer must be raised and bred before her calf can be raised in turn. This is why beef markets move in long cycles. When producers rebuild herds, they hold back female cattle, which reduces supply further in the short term and pushes prices up before they fall.
Market access is granted plant by plant. Many importing countries approve individual processing plants rather than whole countries. A meat plant may need to be registered with the importer's authorities before it can ship there. Gaining, losing or suspending those registrations is one of the most common trade signals in meat.
Disease drives trade. Outbreaks of African swine fever, foot-and-mouth disease or avian influenza can close export markets overnight, and can cut an importing country's own production sharply, forcing it to buy more abroad. Biosecurity signals move meat markets more than almost any other category.
Different markets value different parts. Exporters aim to sell every part of an animal to the market that pays most for it. Prime cuts may go to high-income markets, while offal, feet and other parts go to markets in Asia where they are valued more highly. Losing access to one market can change the economics of a whole carcass.
Dairymilk, powders, butter and cheese
- Keeps
- Days fresh, over a year as powder
- Share traded
- Low: under 7% of milk
- Moves by
- Refrigerated and dry container
- Price set by
- Auctions and negotiated
- Supply responds in
- One to two years
Milk is the least tradable form of one of the world's most traded food groups.
World milk production reached 950 million tonnes in 2024 3. Less than 7% of it is traded internationally 3.
The largest producers are not the largest exporters. India produced 227 million tonnes of milk in 2024 3, but almost all of it is consumed at home.
Exports come from a small group. The United States, New Zealand and the European Union are projected to account for 64% of cheese, 69% of whole milk powder, 73% of butter and 78% of skim milk powder exports in 2034 3.
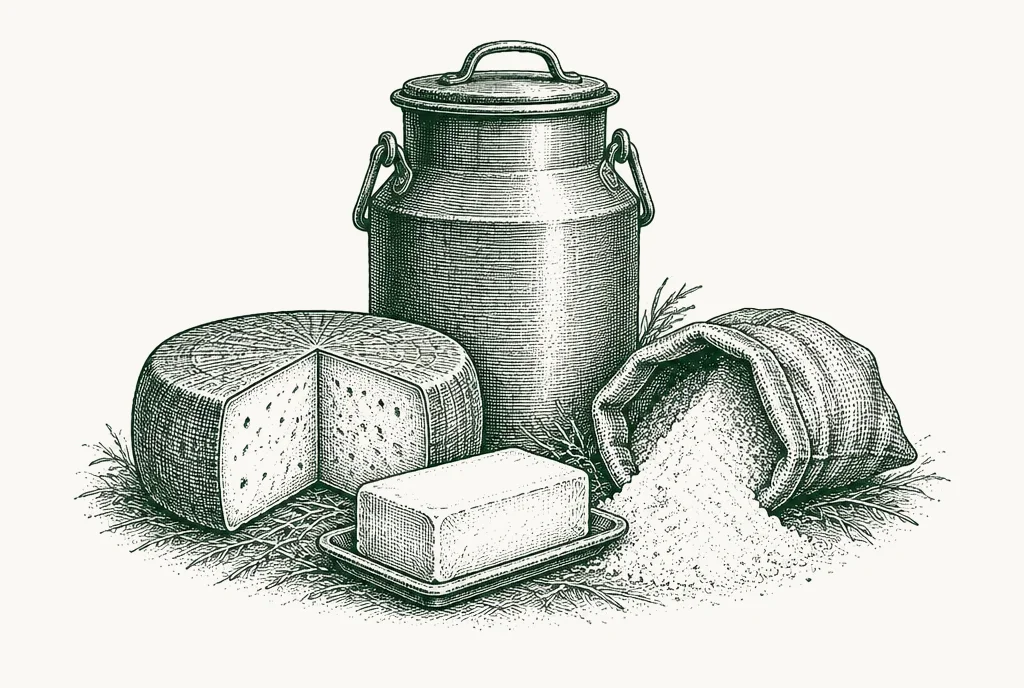
Why powders matter. Powders are how milk travels. Whole milk powder and skim milk powder can be shipped anywhere and stored for over a year. Importers in China, Southeast Asia, the Middle East, North Africa and West Africa rebuild them into liquid milk, or use them in food manufacturing.
How prices are seen. New Zealand's exporters sell a large share of their product through Global Dairy Trade, a regular online auction. Because New Zealand is such a large exporter, those auction results are watched worldwide as a signal of where international dairy prices are heading.

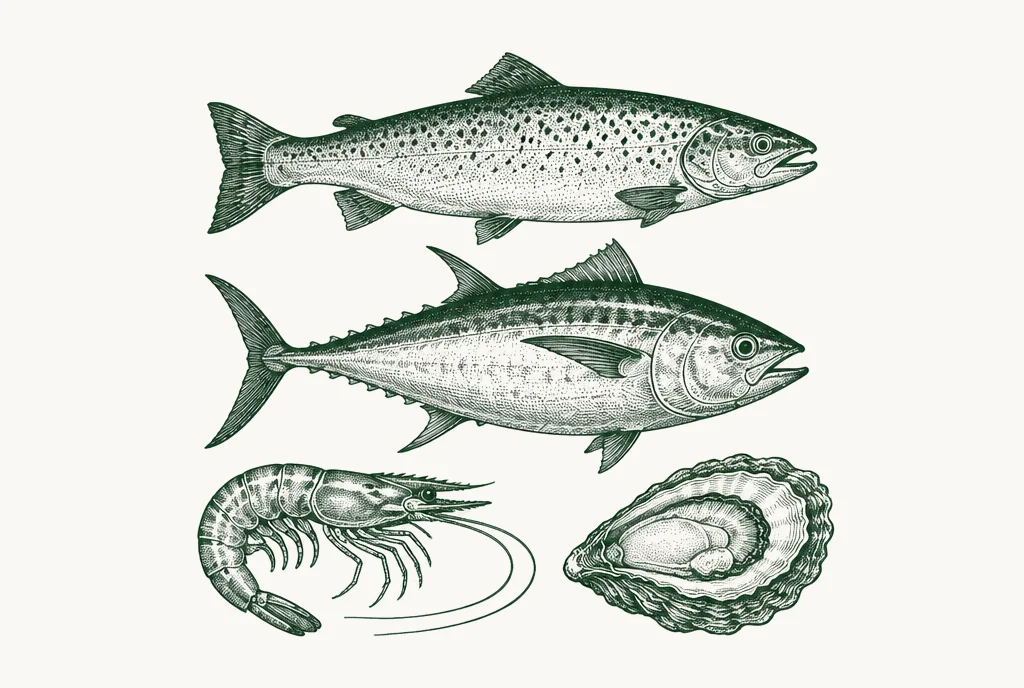
Fish may be caught in one country, processed in another, and eaten in a third.
Seafoodwild and farmed
- Keeps
- Days fresh, months frozen
- Share traded
- High
- Moves by
- Air freight, refrigerated container
- Price set by
- Mostly negotiated
- Supply responds in
- Varies by species
Seafood is really many markets: salmon, shrimp, tuna, whitefish, squid and hundreds of other species, each with its own supply chain.
Farmed now leads wild. In 2022, aquaculture overtook capture fisheries as the main source of aquatic animal production for the first time 2. Wild catches have been broadly stable for decades. Growth now comes from fish farming, mostly in Asia.
Heavily traded. Exports of aquatic animal products reached a record USD 192 billion in 2022 2.
Seafood often crosses borders more than once. Fish may be caught or farmed in one country, processed in another, and eaten in a third. This makes seafood unusually sensitive to rules of origin, tariffs and traceability requirements, and to trade disputes between the countries along the way.
Sugarcane and beet
- Keeps
- Years
- Share traded
- High
- Moves by
- Bulk ship
- Price set by
- Futures
- Supply responds in
- One to several seasons
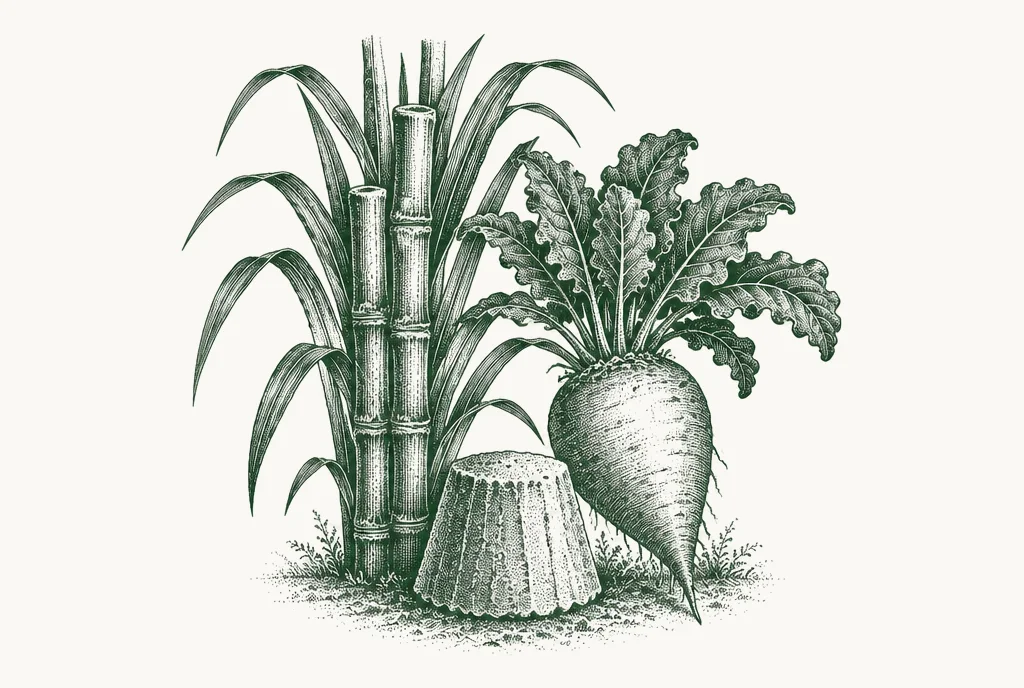
Sugar comes from two very different plants. Sugar cane grows in the tropics and subtropics. Sugar beet grows in temperate regions, including Europe and the northern United States.
Global sugar production for 2026/27 was forecast at 184.9 million tonnes, with world exports at 62.3 million tonnes 8.
Brazil dominates exports. Its sugar exports for 2026/27 were estimated at 33.6 million tonnes 9. Set against USDA's global export forecast, that is more than half of world trade.
The ethanol switch. Brazilian mills can turn sugar cane into either sugar or ethanol, and they shift between the two depending on which pays better. When domestic gasoline prices rise, ethanol becomes more profitable relative to sugar, and mills make less sugar 9. This links the world sugar price directly to Brazilian fuel prices.
Heavily protected. Many countries shield their sugar producers with tariffs and quotas. Access to protected markets such as the EU and the United States is often granted through specific quota arrangements, which makes trade policy unusually important in sugar.
Fruit and vegetablesfresh produce
- Keeps
- Days to weeks
- Share traded
- Low overall, high for some products
- Moves by
- Refrigerated container, air freight
- Price set by
- Negotiated
- Supply responds in
- One season (tree crops: years)
Fruit and vegetables make up a huge part of what people eat, but behave the least like commodities.
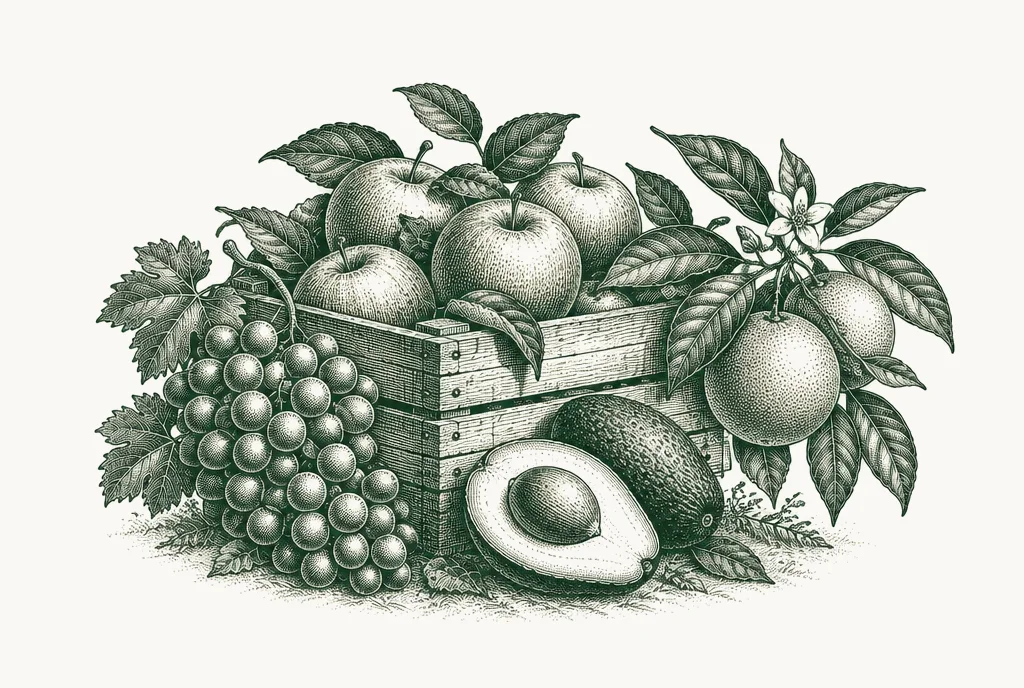
Seasons drive trade. Much international trade in fresh produce fills gaps in the calendar. When it is winter in Europe and North America, grapes, apples, citrus and avocados arrive from South America, South Africa, Australia and New Zealand. This counter-seasonal trade is one of the main reasons fresh produce crosses the equator.
Rules matter enormously. Because fresh produce can carry pests and diseases, importing countries set strict plant health rules. Some require specific treatments or inspections, and some ban products from particular regions entirely. Residue limits on pesticides are another major barrier. Gaining or losing market access for a single fruit can take years of negotiation.
Retailers set the standards. Large supermarket groups often decide what varieties, sizes, packaging and certifications they will accept. For many exporters, retailer requirements matter as much as government rules.
The categories side by side
| Category | How long it keeps | Share traded | How it moves | How price is set | Speed of supply response |
|---|---|---|---|---|---|
| Wheat, corn | Years | Medium | Bulk ship | Futures | One season |
| Rice | Years | Low (thin market) | Bulk and bags | Mostly negotiated | One season |
| Oilseeds, oils | Months to years | High | Bulk ship, tanker | Futures | One season (palm: years) |
| Meat | Months if frozen | Low to medium | Reefer container | Mostly negotiated | Weeks (poultry) to years (beef) |
| Dairy | Days (fresh), over a year (powder) | Low | Reefer and dry container | Auctions, negotiated | One to two years |
| Seafood | Days (fresh), months (frozen) | High | Air, reefer container | Mostly negotiated | Varies by species |
| Sugar | Years | High | Bulk ship | Futures | One to several seasons |
| Fruit, vegetables | Days to weeks | Low overall, high for some products | Reefer, air | Negotiated | One season (tree crops: years) |
"Share traded" here is a broad guide to how much of world output crosses a border, drawing on the figures in this chapter and elsewhere in the guide. It varies by product and year.
How to use this when reading signals
When a GFO signal reports a development in one category, the traits tell you how the market is likely to react.
- A supply shock in a thin, concentrated market such as rice tends to produce sharp price moves.
- A shock in a storable market with deep futures such as wheat shows up in prices immediately, but stocks can soften the effect.
- A disease outbreak in meat can close markets overnight and reshape trade flows for years.
- A change in energy prices reaches corn, vegetable oils and sugar quickly, through biofuels.
- A new rule in fruit and vegetables can shut out an exporter entirely, even if nothing changes in supply or demand.
Chapter 3 turns from categories to countries: which markets matter most, and why.
Sources
- China General Administration of Customs, soybean import data for 2025, via S&P Global Commodity Insights, reported by Hellenic Shipping News, February 2026.↩
- FAO, The State of World Fisheries and Aquaculture 2024, 7 June 2024.↩
- OECD-FAO, Agricultural Outlook 2025–2034, July 2025.↩
- S&P Global Commodity Insights, Brazil soybean projections, reported by Hellenic Shipping News, March 2026.↩
- University of Arkansas, International Rice Outlook 2021–2031, 2021.↩
- USDA ERS, Rice Outlook, May 2025.↩
- USDA ERS, Rice Sector at a Glance.↩
- USDA FAS, Sugar: World Markets and Trade, 28 May 2026.↩
- USDA FAS, Brazil Sugar Annual 9, 20 April 2026, as reported by Sugaronline, 22 April 2026.↩
Last reviewed 21 September 2026
See the system move, every week.
GFO's weekly signal summary tracks the developments that matter across price, trade, supply, biosecurity, regulation and climate. Free, no card required.