How the World Eats / Chapter 5 of 8
What drives demandPopulation, income, age, cities and policy over the next 25 years
The world will need more food, but not everywhere, and not the same food. Where people are born, how much they earn, how old they are and where they live will decide what the system has to supply. Policy decides some of the rest.
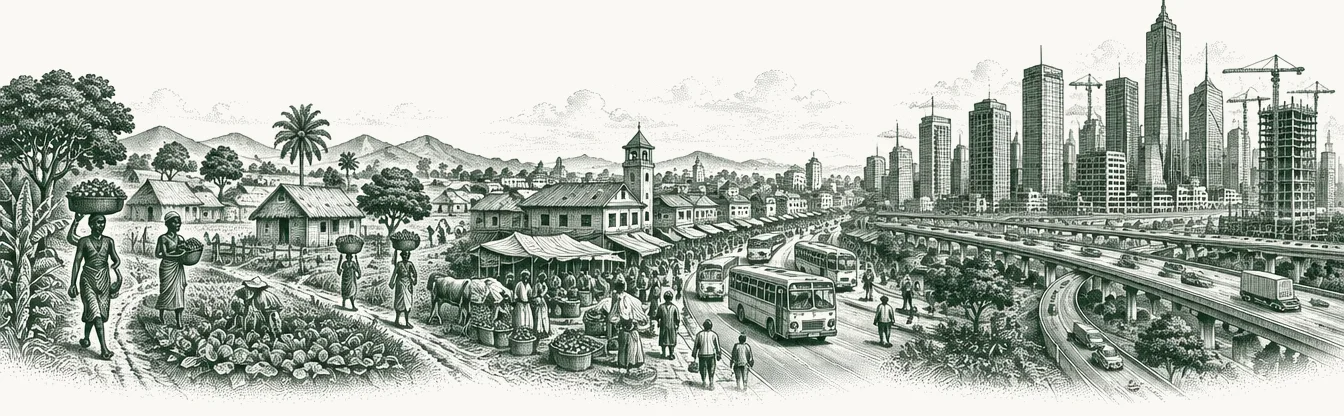
Five forces behind demand
Demand for food is not just a matter of headcount. Five forces shape it, and they are moving in different directions in different parts of the world.
- Populationsets how many people need feeding.
- Agechanges how much and what they eat.
- Incomechanges what they can afford, and so what they choose.
- Citieschange how they shop, cook and eat.
- Policydecides how much farm output goes to fuel, feed and reserves, and how much reaches people.
These are widely used categories in food demand analysis, not a GFO invention. The rest of this chapter takes each in turn, then asks where growth will come from.
Populationhow many, and where
- Growing fastest
- Sub-Saharan Africa and parts of South Asia
- Flat or falling
- Much of East Asia and Europe
- Mostly locked in
- Through population momentum
The world's population was 8.2 billion in 2024. The UN projects it will keep growing for another 50 or 60 years, peaking at around 10.3 billion in the mid-2080s before falling slightly 2.
The total hides very different stories. In 63 countries and areas, holding 28% of the world's people, population has already peaked, and in 126 others it is likely to keep growing through 2054 2. Those that have peaked include China, Germany, Japan and Russia, and their combined population is projected to fall by 14% over the next thirty years 4.
At the other end, some countries are projected to double in size. Angola, the Central African Republic, the Democratic Republic of the Congo, Niger and Somalia are all expected to see their populations double between 2024 and 2054 4.
Much of the growth is already locked in. Because so many young people will reach childbearing age in the coming decades, population momentum is projected to account for 80% of global growth through 2054, around 1.7 billion people 2.
For the food system, this means the location of demand is shifting. The fastest growth in the number of people to feed will be in Sub-Saharan Africa and parts of South Asia. In much of East Asia and Europe, the number of consumers is flat or falling.
Age: an older world eats differently
The world is getting older. By the late 2070s, the number of people aged 65 or over is projected to exceed the number of children under 18 2.
Age matters for food demand in three ways.
Older people eat fewer calories. An ageing population needs less food per person, even if total population is stable.
Tastes and needs change. Older consumers tend to look for foods that support health, are easy to prepare, and come in smaller portions. Protein, dairy and fortified foods often matter more.
Young populations drive volume. In countries with a young and growing population, demand grows simply because more people are reaching adulthood and forming households. Much of Africa and parts of South Asia are in this position.
The result is two different demand profiles. In ageing, high-income markets, growth comes from value, health and convenience, not volume. In young, growing markets, it comes from more people eating more.
Incomericher people eat more protein
- First
- More variety: vegetables, fruit, oils
- Then
- More meat, dairy, eggs and fish
- Later
- Processed food, convenience, eating out
When incomes rise, people do not simply eat more of the same. They change what they eat.
The first change is usually more variety: more vegetables, fruit and vegetable oils. Then comes more animal protein: meat, dairy, eggs and fish. Later, as incomes rise further, demand shifts towards processed foods, convenience and eating out, and the total amount of food per person levels off.
This pattern is well documented and it is the single most important driver of change in global food markets. The OECD and FAO project that global per capita calorie intake from animal-source foods will rise by 6% over the next decade, driven largely by lower-middle-income countries, where it is expected to rise by 24% 1.
Animal-source foods: who gets how much
That growth will bring average intake of animal-source foods in lower-middle-income countries to 364 calories a day, while in low-income countries it is projected to reach only 143 calories, well below the 300-calorie benchmark FAO uses for a healthy diet 1.
This matters for the whole system because animal protein takes more resources to produce than plant food. Every extra kilogram of meat or dairy requires feed grains, oilseeds, water and land. So rising incomes in one region raise demand for corn and soybeans somewhere else. This is the link between a growing middle class in Asia and the soybean fields of Brazil described in Chapters 2 and 3.
The effect is not guaranteed. It depends on incomes actually rising, on food prices, and on culture. India, for example, has seen rapid income growth, but many households eat little or no meat, so its protein demand has grown mainly through dairy.
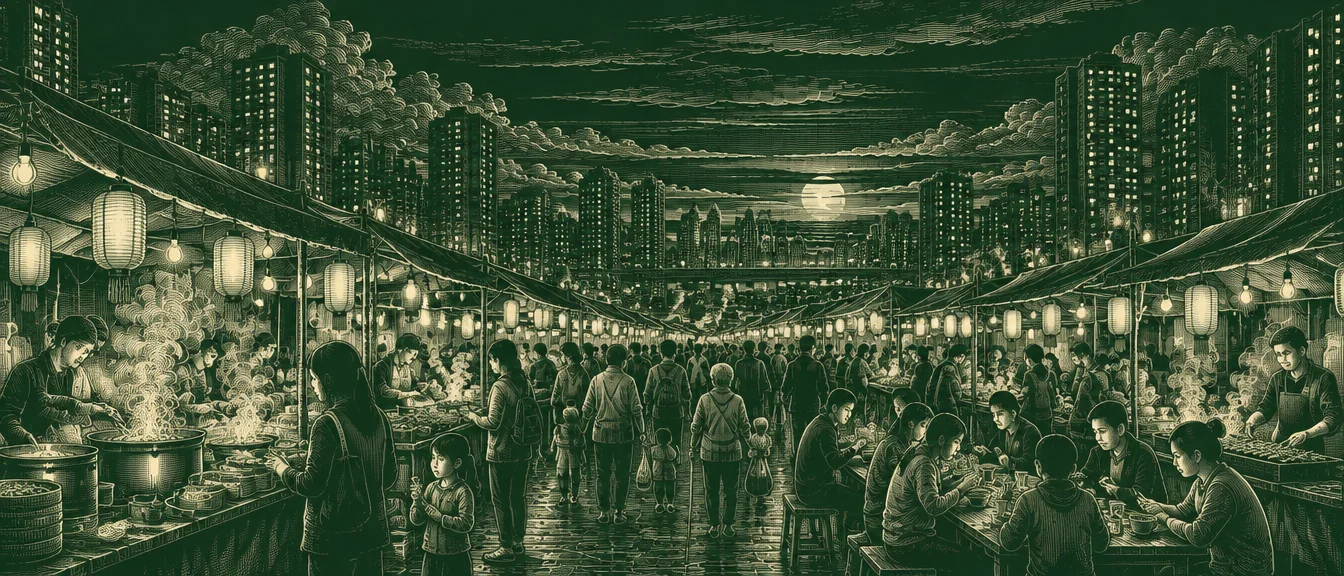
Demand grows where people and incomes grow, and increasingly, where cities grow.
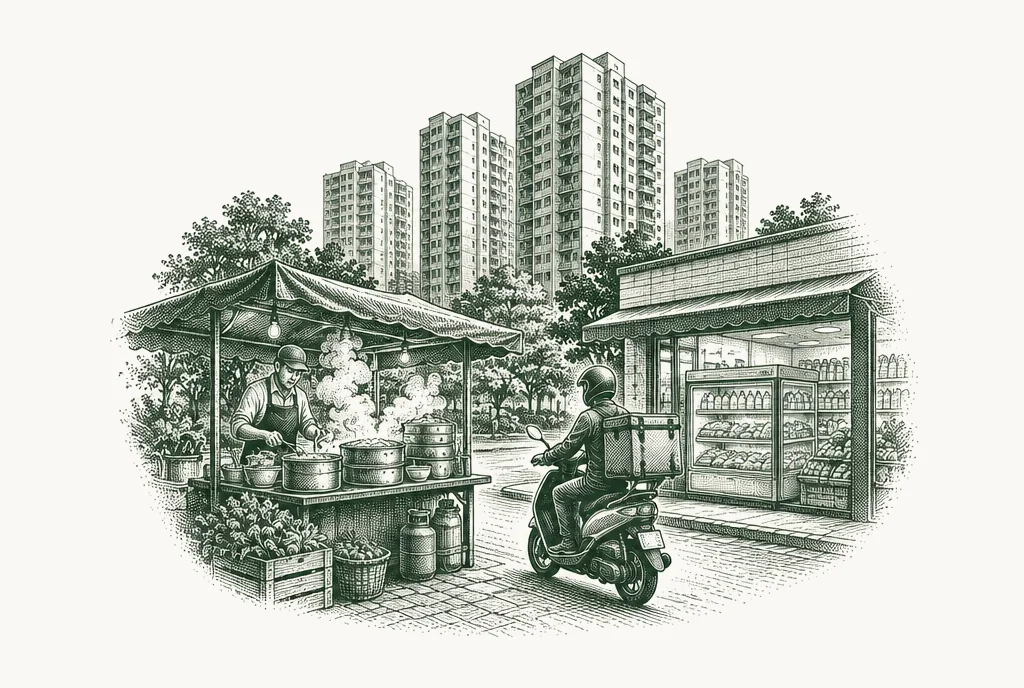
Citieshow urban life changes the plate
- Shop
- Supermarkets, online, traditional markets
- Eat
- More processed food and meals out
- Need
- Cold chains, and often imports
Where people live changes how they eat.
In 2025, cities were home to 45% of the world's 8.2 billion people, more than double the 20% share in 1950 3. Two-thirds of population growth between now and 2050 is projected to happen in cities, with most of the rest in towns, while the rural population is expected to peak in the 2040s 3.
A note on the numbers: the 2025 edition uses a new, stricter definition of a city, so it reports a lower urban share than earlier editions did. The direction of travel is the same.
City life changes demand in several ways.
People buy more of their food. Urban households grow little of what they eat. They depend entirely on markets, and often on imports.
They buy more processed and packaged food. Longer working hours, smaller kitchens and longer commutes favour food that is quick to prepare.
They eat out more. Street food, restaurants and delivery take a larger share of spending. As Chapter 1 showed, that shifts value away from the farm and towards preparation and service.
They shop differently. Supermarkets, convenience stores and online grocers grow alongside traditional markets. Those retailers set standards that reshape supply chains.
They need cold chains. Fresh meat, dairy, fish and produce must be kept chilled from port or farm to shelf. Cold chain investment often decides whether imported protein can reach a city at all.
Cities are also getting bigger. The number of megacities with 10 million people or more rose from 8 in 1975 to 33 in 2025 3. Many of the fastest-growing cities, though, are smaller ones in Africa and Asia.
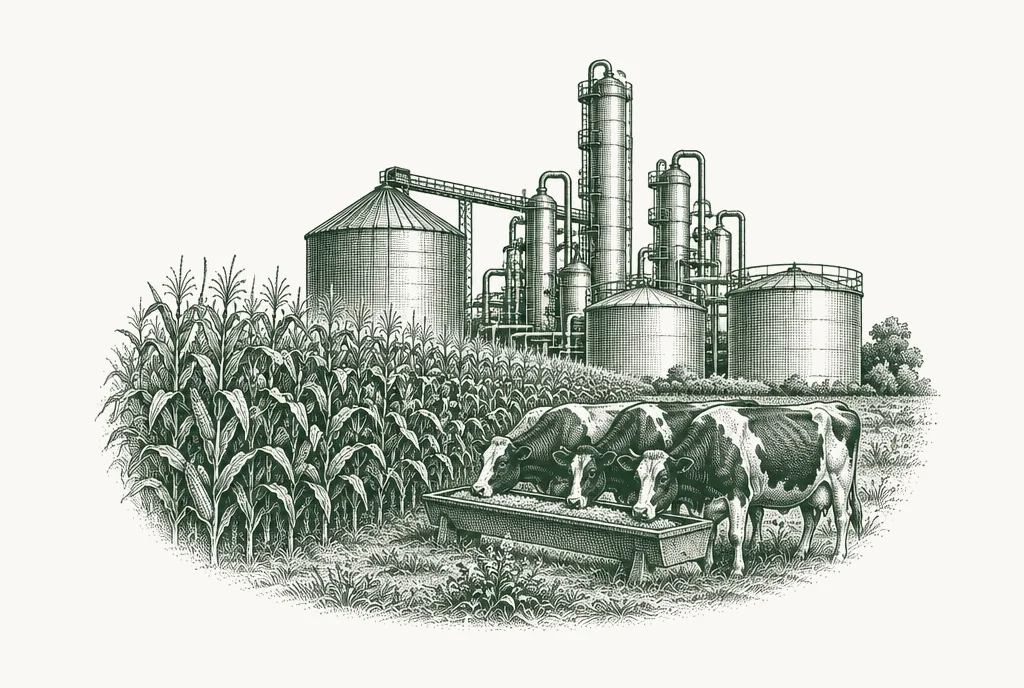
Policyfood, feed, fuel and reserves
- Feed
- A large share of the world's grain
- Fuel
- Ethanol and biodiesel mandates
- Reserves
- State stockpiles of staple foods
Not all demand for farm products comes from people eating them. Governments shape a large part of it.
Feed. A large share of the world's grain is fed to animals. By 2034, 40% of cereals are projected to go directly to human consumption, 33% to animal feed, and the rest to biofuels and industrial uses 1.
Fuel. Biofuel policies turn crops into energy: corn and sugar cane into ethanol, and vegetable oils into biodiesel and renewable diesel. Biofuel demand is projected to grow by 0.9% a year, led by Brazil, India and Indonesia 1. Blending mandates, set by governments, decide how much. A change in a single country's biofuel rules can move world prices for corn, sugar or vegetable oil.
Reserves. Many governments hold strategic stocks of staple foods and buy to fill them. China's state reserves are the largest example. Stockpiling decisions can add to or subtract from world demand in a given year.
Food policy. Subsidies, school feeding programmes, food safety rules and dietary guidelines all influence what people buy. Tariffs and import rules decide whether demand is met from domestic or foreign supply.
Policy-driven demand can change faster than population or income. That makes it one of the most important things to watch.
Where growth will come from
Put the five forces together and a broad picture emerges.
Sub-Saharan Africa combines the fastest population growth with rising urbanisation. From a low base, it is likely to be one of the largest sources of new demand for staple foods, vegetable oils, dairy powder and, as incomes rise, animal protein. Much of that will need to be imported unless regional production grows quickly.
South Asia combines a very large population, still growing in many countries, with rising incomes. Dairy, vegetable oils, pulses and, in some countries, poultry are likely to lead.
Southeast Asia is richer and more urban, with fast-growing demand for meat, dairy, seafood and processed food.
China remains the largest single market, but its population is falling and ageing. Growth is likely to come from quality, safety, convenience and specific categories rather than from overall volume.
High-income markets in Europe, North America, Japan and Korea are largely stable in volume. Change there comes from health, sustainability, convenience and price.
This is a direction of travel, not a forecast. It depends on incomes rising as expected, on food prices, on policy and on how production keeps up.
What could change the picture
Demand projections are useful, but they can be wrong. Several things could shift them.
- Income shocks. A recession, a currency crisis or a debt crisis can stall demand growth in middle-income countries for years.
- Prices. If food becomes more expensive relative to incomes, people eat less protein and more staples.
- Policy. Changes to biofuel mandates, subsidies or trade rules can add or remove large amounts of demand quickly.
- Health and culture. Concern about health, sustainability or animal welfare can change diets in some markets, though so far it has moved slowly at a global level.
- Technology. New ways of producing protein, or new medicines that change appetite, could alter demand in ways that are not yet clear.
GFO signals often track these turning points. A single policy change or economic shock can matter more for demand than a decade of steady trends.
How to use this when reading signals
When a GFO signal reports a development affecting demand, ask:
- Is it about volume or value? Population growth adds volume. Ageing and rising incomes change what is bought and how much people pay.
- Is it structural or cyclical? Demographic change is slow and predictable. Income, price and policy shifts can reverse.
- Where does the extra demand land in the chain? More demand for meat in Asia means more demand for feed grains and oilseeds in the Americas.
Chapter 6 looks at the other side: the forces that disrupt supply and cause shocks and shortages.
Sources
- OECD-FAO, Agricultural Outlook 2025–2034, July 2025.↩
- UN DESA, World Population Prospects 2024, July 2024.↩
- UN DESA, World Urbanization Prospects 2025: Summary of Results, 18 November 2025.↩
- UN News, reporting World Population Prospects 2024, July 2024.↩
Last reviewed 21 September 2026
See the system move, every week.
GFO's weekly signal summary tracks the developments that matter across price, trade, supply, biosecurity, regulation and climate. Free, no card required.