How the World Eats / Chapter 1 of 8
The moving partsHow food gets from the field to the table, and who does what along the way
Almost every food product passes through the same six stages. Each stage is run by different kinds of businesses, makes money in a different way, and is exposed to different risks. Understanding those differences explains a great deal about how the system behaves.
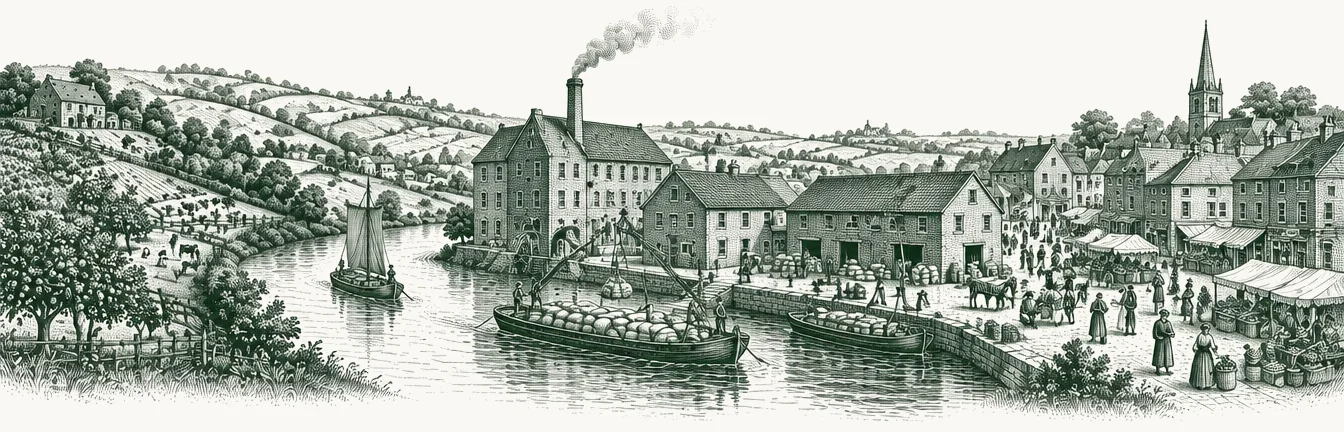
The shape of the chain
The six stages are inputs, production, processing, trade and logistics, retail and foodservice, and consumption.
At each end there are enormous numbers of participants: hundreds of millions of farms at one end, billions of consumers at the other. In between, the number of businesses shrinks sharply. A relatively small group of companies supplies most of the world's seed and fertiliser, trades most of its grain, and runs most of its supermarkets in wealthy countries.
Researchers often describe this as an hourglass. It is a widely used idea, not a GFO invention, and it is a useful one. The narrow middle is where buying power sits, where much of the margin is made, and where a disruption to a single firm or facility can affect millions of people on both sides.
For each stage below, three questions are worth asking. Who does it? How concentrated is it? What is it exposed to?
Stage 1 of 6
Inputswhat farming needs before anything grows
- Who
- Seed, crop protection, fertiliser and feed companies; energy suppliers; lenders
- Concentration
- High in most categories
- Exposed to
- Energy prices, sanctions, trade restrictions
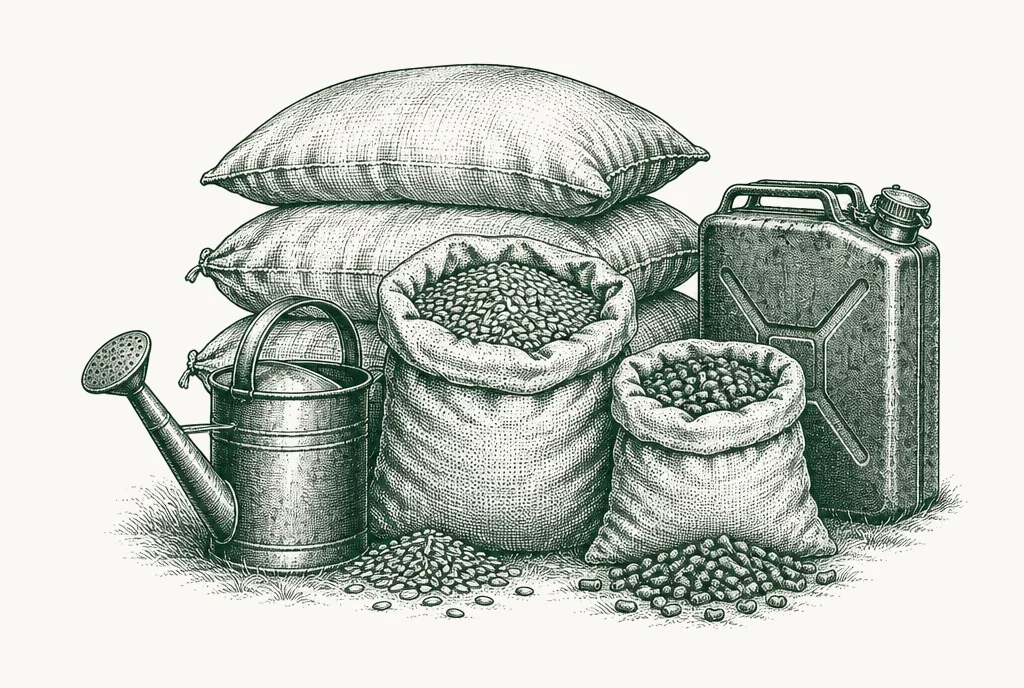
Before anything is grown, someone has to supply what farming needs. Seed. Fertiliser. Crop protection chemicals. Animal feed and breeding stock. Fuel and electricity. Water. And the finance to pay for all of it before the harvest comes in.
Who does it. Specialist companies, many of them large and global. Seed and crop protection are dominated by a handful of multinationals. Fertiliser production is concentrated in countries with cheap natural gas (for nitrogen) or large mineral deposits (for potash and phosphate). Animal feed is often supplied by the same companies that trade and process grain.
How concentrated. Highly, in most categories. A farmer typically has a few suppliers to choose from, and those suppliers set prices with global markets in mind.
What it is exposed to. Energy prices above all. Nitrogen fertiliser is made from natural gas, so a gas price shock becomes a fertiliser price shock within months. Inputs are also exposed to trade restrictions and sanctions, because production is concentrated in a small number of countries.
Why it matters. Farmers are price takers on both sides. They usually cannot set the price of what they sell, and they cannot set the price of what they buy. When input costs rise faster than crop prices, farmers respond by using less fertiliser or planting less. That shows up in next season's harvest.
Stage 2 of 6
Productionfarming, fishing and fish farming
- Who
- Hundreds of millions of farms, plus fishers and fish farmers
- Concentration
- Low by number of farms, much higher by land
- Exposed to
- Weather, disease, input costs, price
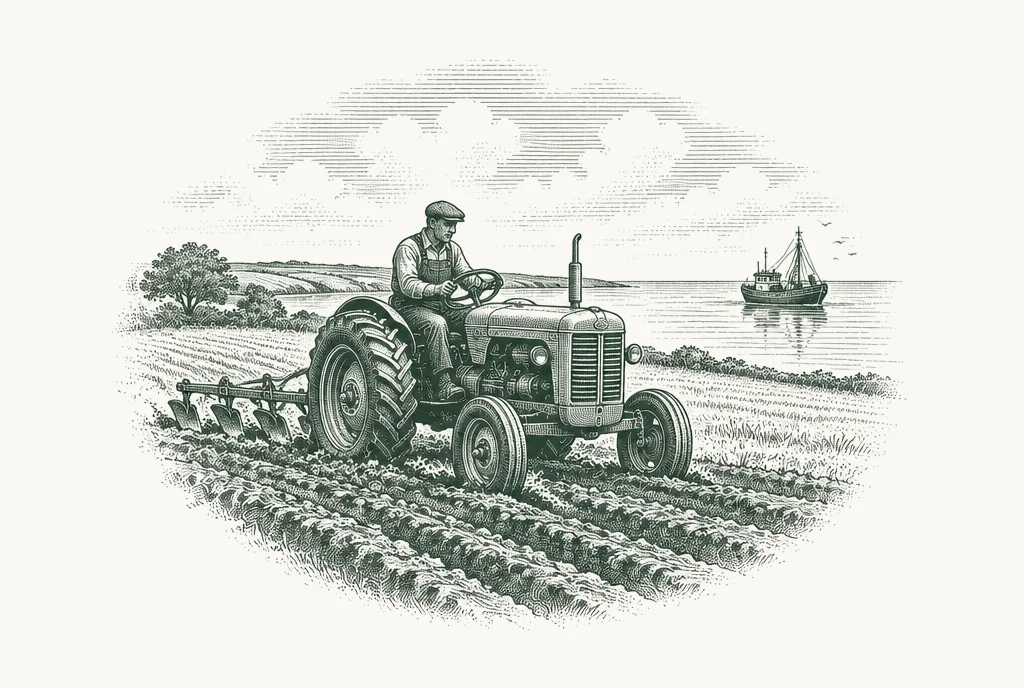
This is farming, fishing and fish farming: turning inputs, land, water and labour into crops, animals and aquatic food.
Who does it. A very large and very varied group. There are more than 608 million farms in the world 3.
Most of them are small. Farms of less than two hectares make up 84% of all farms, but operate only around 12% of agricultural land and produce roughly 36% of the world's food 3.
At the other end, the largest 1% of farms, those above 50 hectares, operate more than 70% of the world's farmland 1.
So production is fragmented by number of farms, but much less fragmented by land. The large commercial farms of the Americas, the Black Sea, Australia and parts of Europe supply most of what enters world trade.
Fish farming is now as important as fishing. In 2022, aquaculture overtook capture fisheries as the main source of aquatic animal production for the first time, at 94.4 million tonnes or 51% of the total 2.
How concentrated. Not very, at the farm level. That is why farmers have little pricing power.
What it is exposed to. Weather, disease, input costs and price. Production is where Climate and Biosecurity signals hit first.
Why it matters. Farming responds slowly. A wheat crop takes months from planting to harvest. A dairy herd takes years to expand. A beef herd takes longer still, because a heifer has to be raised before she can calve. Orchards and plantations take years to come into production.
This slow response is one of the most important facts about the whole system. When demand rises or supply falls suddenly, farms cannot quickly produce more. Prices have to move, sometimes a long way, before supply catches up. When it does catch up, it often overshoots, and prices fall. Much of the boom and bust in agricultural markets comes from this lag.
A second point: a large share of crops is not eaten directly by people. It is fed to animals. Corn, soybean meal and other feeds turn into meat, milk and eggs. This links grain and oilseed markets tightly to livestock markets. A poor soybean harvest in South America affects the cost of producing pork in China and chicken in Europe.
Stage 3 of 6
Processingturning raw output into food
- Who
- Mills, crushers, meatpackers, dairies, food manufacturers
- Concentration
- Often high within a country
- Exposed to
- Raw material and energy costs, labour, food safety rules, export access
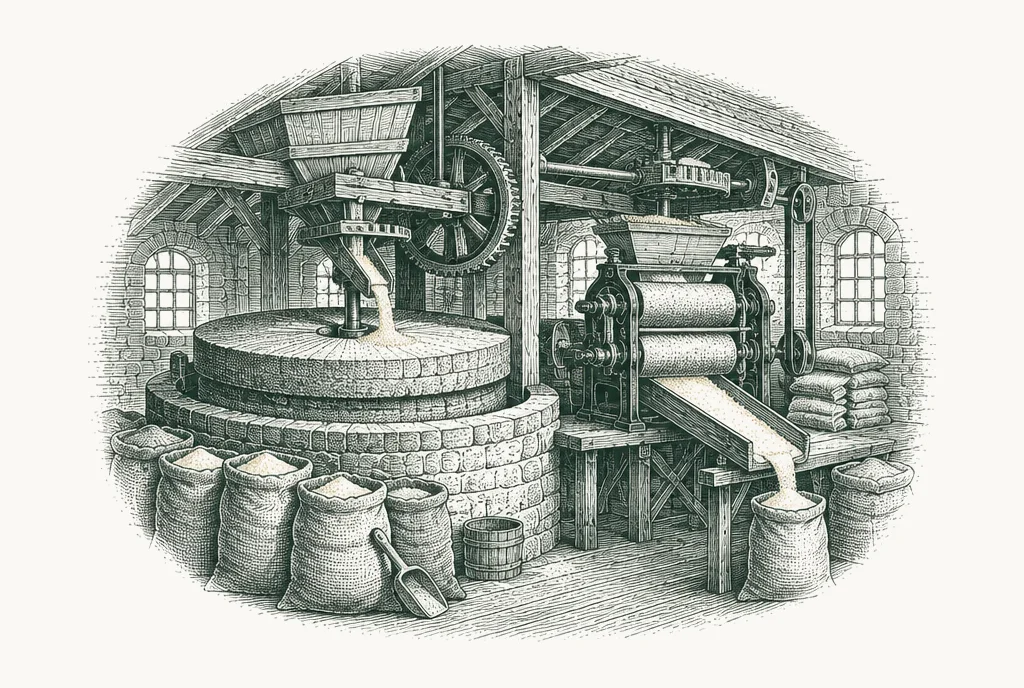
Processing turns raw farm output into food, or into ingredients for food.
It helps to split it into two parts. First-stage processing handles the raw commodity: milling wheat into flour, crushing soybeans into oil and meal, slaughtering animals and cutting meat, turning milk into cheese, butter and powder. Second-stage processing makes finished products from those ingredients: bread, biscuits, ready meals, branded dairy and snacks.
Who does it. First-stage processing is dominated by large, capital-intensive plants, often owned by the same companies that trade the commodity. Second-stage processing includes the global food and drink brands, along with many thousands of smaller local manufacturers.
How concentrated. First-stage processing is often highly concentrated within a country, because plants are expensive and benefit from scale. Meatpacking and oilseed crushing are good examples.
What it is exposed to. Raw material prices, energy costs, labour, food safety rules and export access.
Why it matters. Processing is where perishable products become storable and tradable. Fresh milk lasts days. Milk powder lasts more than a year and can be shipped across the world. A live animal cannot easily cross an ocean. Frozen cuts can. Soybeans become two products, oil and meal, which are sold into completely different markets.
That last point introduces an idea worth knowing early: co-products. When one raw material produces several outputs, the processor's margin depends on the combined value of all of them. A soybean crusher cares about the price of oil and meal together. A beef packer earns money from hides and offal as well as steaks. Changes in demand for one co-product can change the economics of the whole chain.
Processing is also where market access is often granted. Many importing countries approve individual plants rather than whole countries. A meat or dairy plant may need to be registered with an importer's authorities before it can ship there. This makes processing the point where Regulation and Biosecurity signals turn into real commercial consequences.
Stage 4 of 6
Trade and logisticsstoring food and moving it
- Who
- Global merchants, shipping lines, ports, storage, insurers, banks
- Concentration
- High for bulk grains and oilseeds, lower elsewhere
- Exposed to
- Freight, insurance, currencies, trade policy, chokepoints
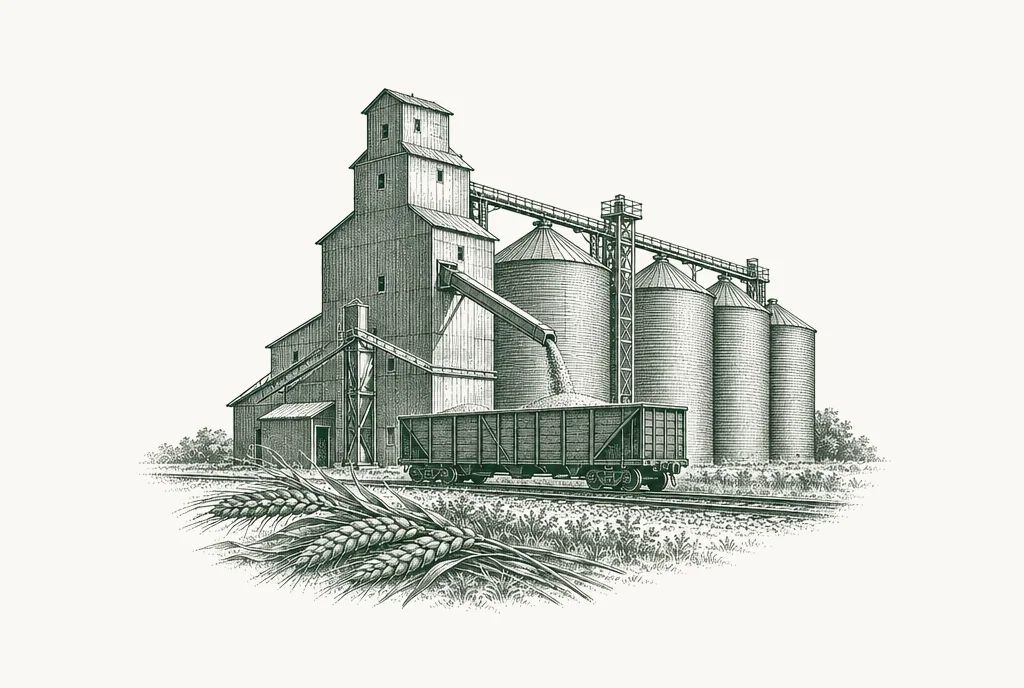
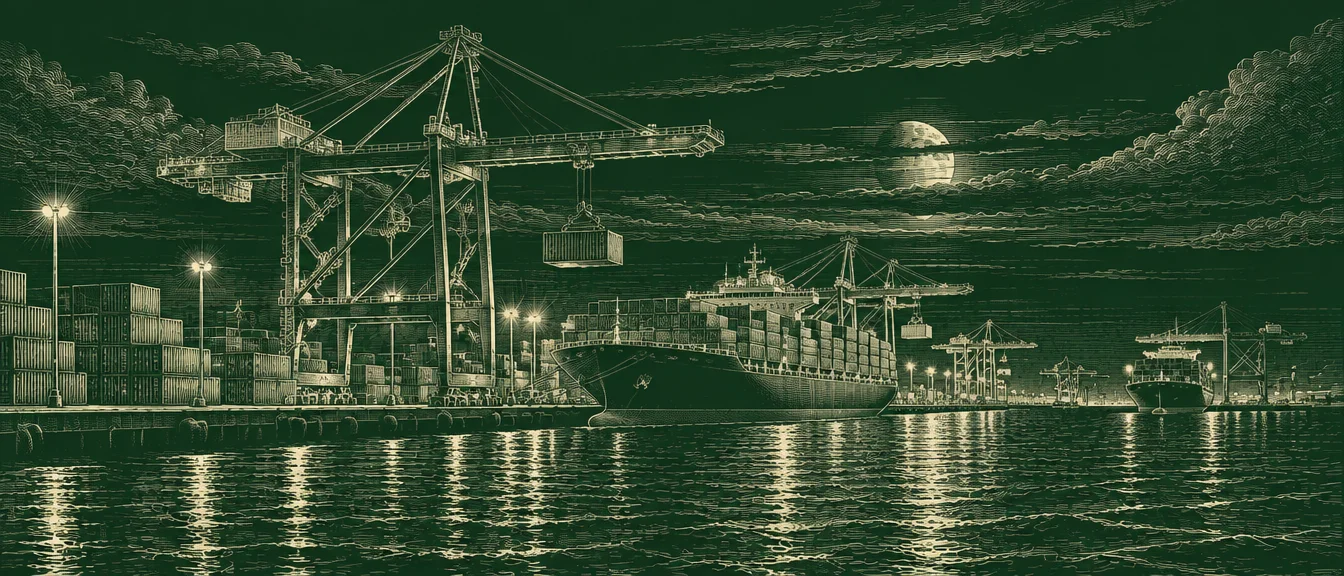
This stage stores food and moves it: between regions of a country, and between countries.
Who does it. For bulk commodities such as grains and oilseeds, a small group of global merchants handles a large share of international trade. The best known are ADM, Bunge, Cargill and Louis Dreyfus, alongside China's state-owned COFCO. Around them sit shipping lines, port operators, storage companies, freight forwarders, insurers and banks. Meat, dairy and seafood are traded through a wider mix of exporters, processors and specialist traders.
How concentrated. Concentrated for bulk grains and oilseeds. Less so for most other categories.
What it is exposed to. Freight rates, insurance costs, currency movements, trade policy and disruption at ports and chokepoints.
Why it matters. Traders connect surplus regions to deficit regions. Their business is not mainly about whether prices are high or low. It is about the differences between prices: between one origin and another, one month and another, one product and another. A merchant makes money by buying where food is cheap, storing it until it is needed, and moving it to where it is valued more, while managing the risk that prices change along the way.
How food moves depends on what it is. Grains and oilseeds travel in bulk ships. Frozen meat, dairy and seafood mostly travel in refrigerated containers. Fresh fruit and vegetables need cold chains from farm to shelf. Each has different costs, different routes and different weak points.
Storage is also a crucial part of this stage. Grain held in silos and warehouses is the system's main buffer. When stocks are high, a poor harvest can be absorbed. When they are low, the same harvest shortfall can send prices sharply higher. Chapter 7 returns to this through the stocks-to-use ratio, one of the most watched numbers in agricultural markets.
Two trade terms appear often in GFO signals. FOB (free on board) is the price of goods loaded onto a ship at the export port. CIF (cost, insurance and freight) is the price delivered to the destination port. The gap between them is the cost of getting there. When freight or insurance costs rise, that gap widens. The glossary in Chapter 8 covers these and other terms.
Stage 5 of 6
Retail and foodservicewhere food is sold
- Who
- Supermarkets, discounters, traditional markets, restaurants, institutions
- Concentration
- High in high-income markets, lower elsewhere
- Exposed to
- Consumer spending, competition, labour costs, labelling rules
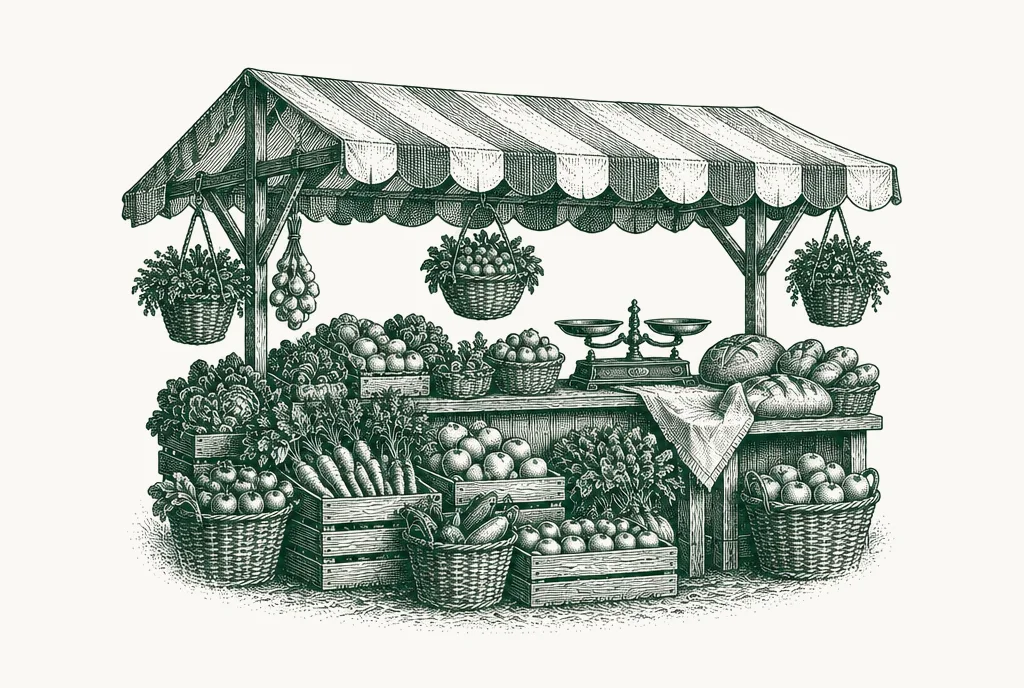
This is where food is sold to the people who eat it. Retail covers supermarkets, convenience stores, discounters, online grocers and traditional markets. Foodservice covers restaurants, cafés, takeaways, hotels, and institutions such as schools, hospitals and the armed forces.
Who does it. In wealthy countries, a small number of supermarket groups usually control most grocery sales in each market. In much of Africa, South Asia and Southeast Asia, traditional markets and small independent shops still account for a large share of food purchases, though modern retail is growing.
How concentrated. Highly concentrated in most high-income markets. Much less so elsewhere.
What it is exposed to. Consumer spending, competition, labour costs, and rules on labelling, pricing and product standards.
Why it matters. Large retailers have strong buying power over suppliers. Many sell private label (own-brand) products, which compete directly with branded manufacturers. Retailers also set the standards that suppliers must meet, on food safety, packaging and increasingly on sustainability, often going beyond what the law requires.
Foodservice matters because it changes where the money goes. A meal in a restaurant includes far more labour, rent and preparation than the same food bought in a shop. As more of a country's food spending moves to eating out, less of each consumer's food budget reaches the farm.
Stage 6 of 6
Consumptioneating, and wasting
- Who
- Around eight billion people
- Concentration
- None: the most fragmented stage
- Exposed to
- Income, prices, culture, health, policy
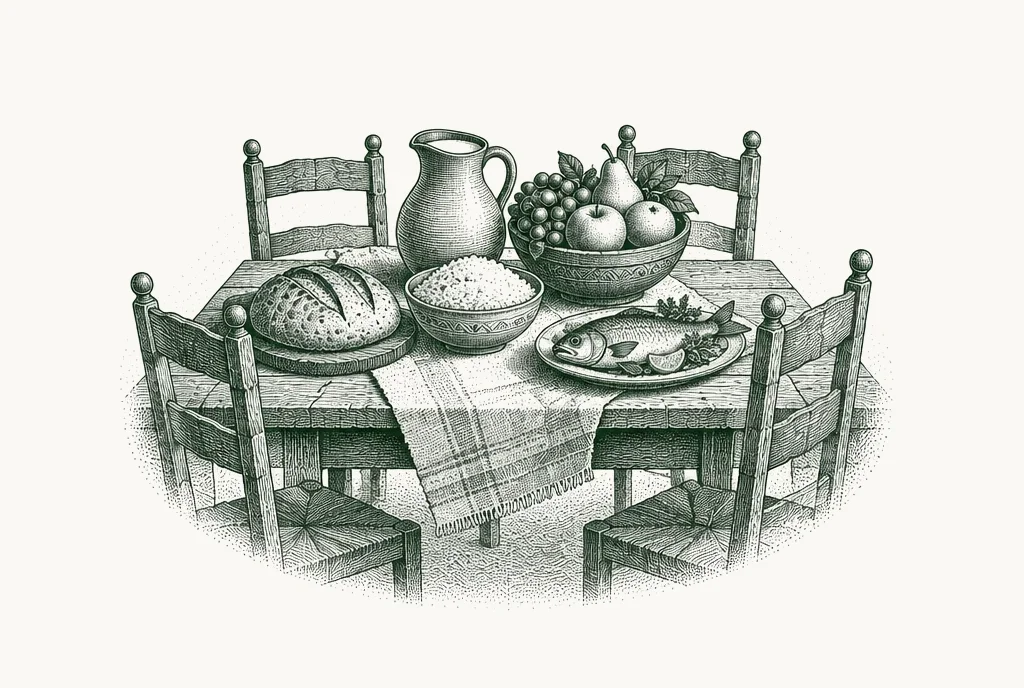
The last stage is eating, and wasting.
Who does it. Everyone. Around eight billion people, in billions of households, with very different incomes, diets and habits.
What it is exposed to. Income, prices, culture, health concerns and policy.
Why it matters. Consumers send the demand signal that the rest of the chain responds to. When incomes rise, diets change: people tend to eat more meat, dairy, fish, fruit and processed food. Those changes ripple back through every stage. Chapter 5 covers demand in detail.
Consumption is also where much food is lost. In 2022 the world wasted 1.05 billion tonnes of food, around 19% of the food available to consumers, at retail, foodservice and household level 4. That is on top of an estimated 13% of food lost between harvest and retail 4.
Households account for most of it: 631 million tonnes, or around 60% of the total wasted in 2022 4.
Most of the value in the food system is added after the farm gate.
Where the money goes
Money flows back down the chain, in the opposite direction to the food. Each stage takes a share.
The most detailed public measurement of this comes from the United States. In 2024, US farms received 11.8 cents of every dollar spent on domestically produced food. The remaining 88.2 cents covered transport, processing, retailing, foodservice and other costs after the farm gate 5.
The farm share is lower for food eaten out. In 2023, the marketing share (everything after the farm) was 75.7 cents per dollar spent on food at home, but 94.6 cents per dollar spent on food away from home 5.
Two cautions apply. These figures describe one high-income country with a large foodservice sector. The farm share is generally higher in lower-income countries, where more food is bought raw and less is processed or eaten out. And the US series was revised in 2026 with a new methodology, so older figures are not directly comparable with the latest ones.
The general pattern, though, holds widely. Most of the value in the food system is added after the farm gate. Farmers carry much of the price risk, because they commit to costs months or years before they know what they will be paid. The businesses in the narrow middle of the hourglass usually earn more stable margins, because their income depends more on volumes and price differences than on the level of prices.
That is not a fixed rule. Margins move through the cycle. Meatpackers can have very good years and very bad ones. Farmers do well when prices spike. But over time, the direction of travel has been towards a smaller farm share of the consumer's spending.
Follow the signal along the chain
Each stage produces its own kind of signal. Knowing which stage a signal belongs to tells you where to look for the consequences.
A shock rarely stays in one stage. A gas price spike (inputs) raises fertiliser costs, reduces application rates, lowers yields (production), tightens supply for crushers and millers (processing), draws down stocks (trade), and eventually raises food prices (retail and consumption). Following a signal along the chain is one of the most useful habits in reading the food system.
Sources
- FAO, "Small family farmers produce a third of the world's food", news release, 23 April 2021.↩
- FAO, The State of World Fisheries and Aquaculture 2024, 7 June 2024.↩
- Lowder, S.K., Sánchez, M.V. and Bertini, R., "Which farms feed the world and has farmland become more concentrated?", World Development, 2021.↩
- UNEP, Food Waste Index Report 2024, 27 March 2024.↩
- USDA Economic Research Service, Food Dollar Series, updated 18 November 2024 and 10 March 2026.↩
Last reviewed 21 September 2026
See the system move, every week.
GFO's weekly signal summary tracks the developments that matter across price, trade, supply, biosecurity, regulation and climate. Free, no card required.